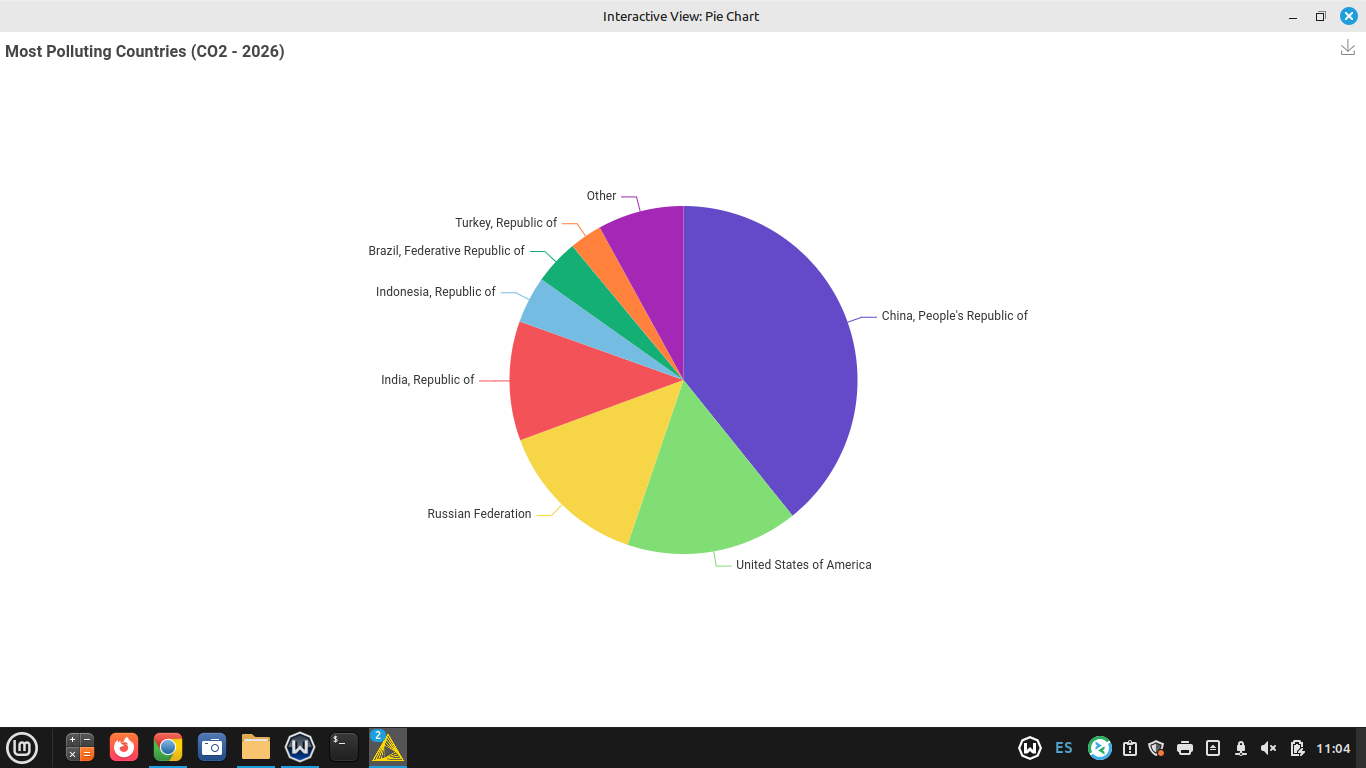
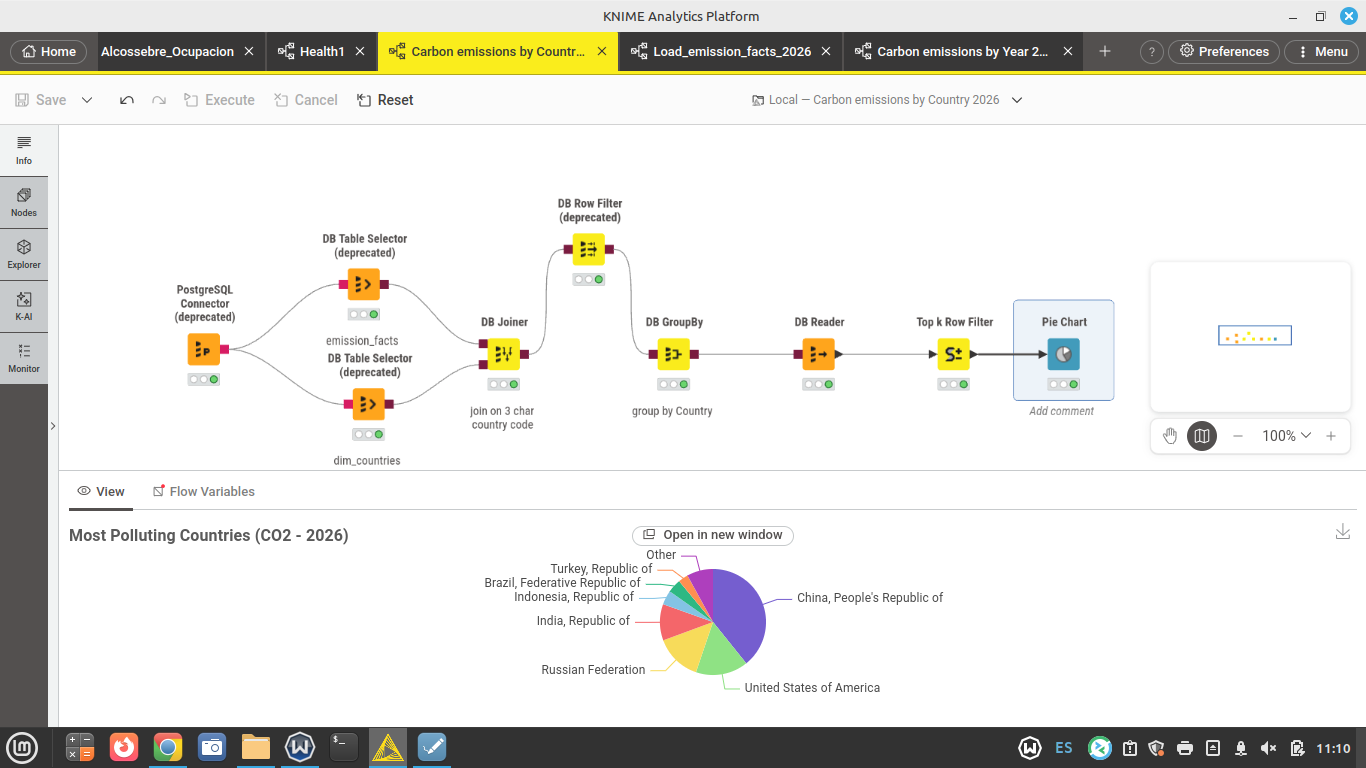
On the pie chart below you can see the most polluting countries CO2 - wise. Data is for the first half of 2026. The source is climatetrace.org. Below is the Workflow used to produce the graph :